
AI WORKFLOWS / ANALYSIS
Gemini’s file editor: make a chart, then audit the numbers
Gemini can now create and edit spreadsheets inside a chat. A small chart exercise helps learners and creators catch wrong values, labels and visual claims before sharing.
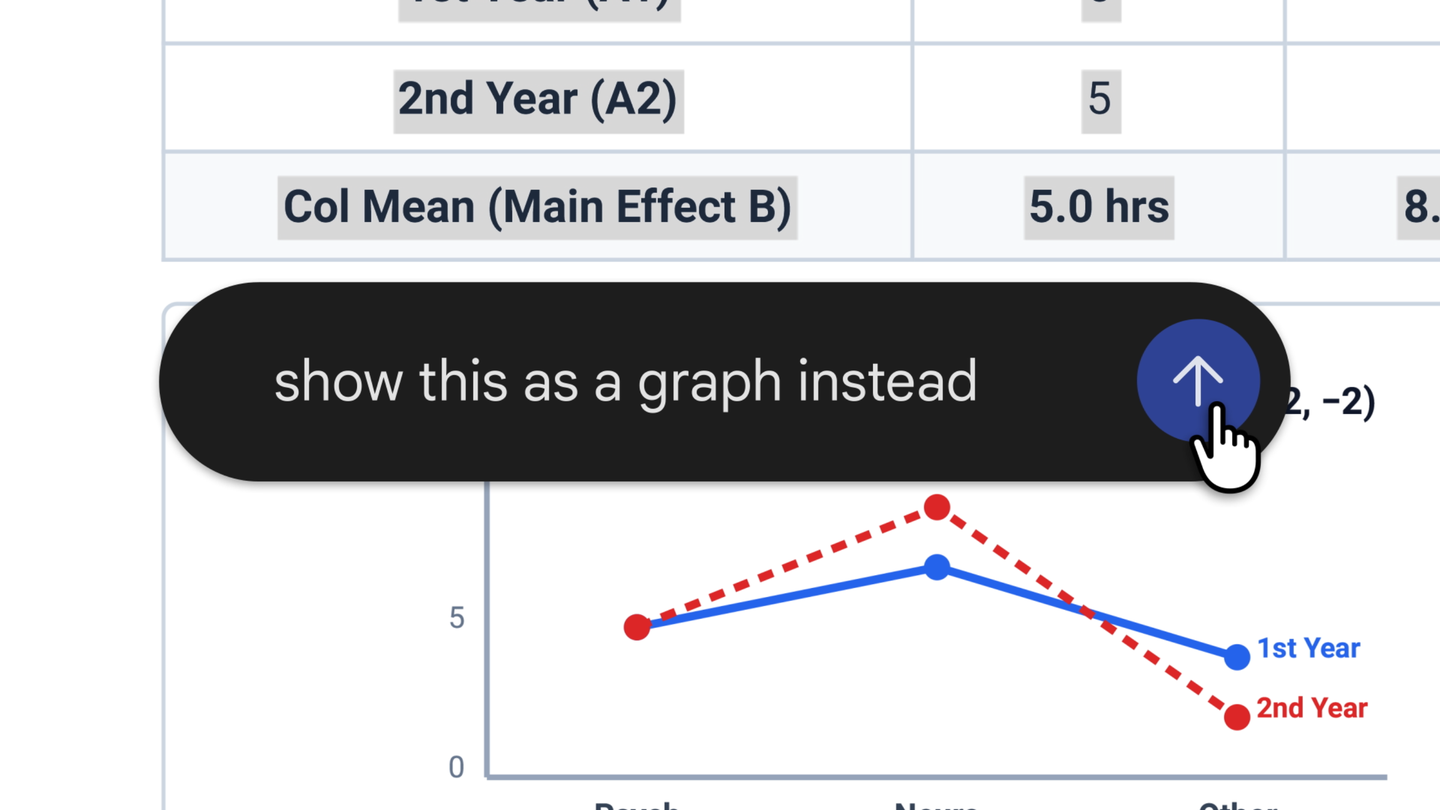
Google said on 29 October 2026 that Gemini users can generate, preview and edit files directly inside a chat. Documents, spreadsheets, slide decks, Markdown, text and code are supported on the web; PDF preview and editing also work on mobile. The Workspace update says a user can build a structured table, preview it, and open it in Google Sheets. That makes a chart a tempting one-prompt deliverable. It also makes the old verification problem more visible: a polished graph is only useful if its numbers and labels survive inspection. [1] [2]
Start with five rows you can check
Use a harmless dataset you control, such as five weekly study hours or five campaign posts with their view counts. Write the values and units in plain text before asking Gemini for anything. If the numbers came from a report, keep that report beside the chat. Do not upload client data or personal records unless you have permission and have checked the account’s data-handling settings.
On the web version, ask Gemini to turn the five rows into a table and a simple chart. Specify the horizontal axis, vertical unit, title and date range. Google says files can be previewed and edited in the chat, including direct text edits or highlighting a part for refinement. Treat that preview as a draft, not as evidence that the source was read correctly. [1] [2]
Audit the table before the visual
Compare each generated cell with the original list. Check whether any row disappeared, a unit changed, or a zero became a blank. Then inspect the plotted points one by one. If the table says Tuesday had 12 views, the chart should not place Tuesday at 21. Look at the axis origin and scale as well: a cropped vertical axis can make a modest change look dramatic.
Ask for one correction at a time, such as “Change Tuesday to 12 and redraw the chart; leave all other rows unchanged.” Recheck the entire table after the edit, because a correct instruction does not guarantee an unchanged result. A learner can use the same process for revision time; a creator can use it for a small content-performance snapshot. Neither example establishes that Gemini is accurate on a larger dataset.
Share the checked file, with context
Google’s Workspace announcement says a generated spreadsheet can be opened in Google Sheets. Once there, make a final manual check of formulas, labels and source dates before sending a link or exporting a screenshot. Put the source and measurement period next to the chart, especially when it could influence a decision. If you cannot trace a value to its origin, remove the claim rather than decorating it. [2]
This is a quick audit exercise, not a WASSAI benchmark of Gemini. Keep the original five rows, the prompt and the final file together. Then ask a simple question: did inline editing save time after verification, or did correcting the chart take longer than making it yourself? That answer is more useful than the smoothness of the first preview.
Sources
- Google: You can now generate, preview, and edit documents, PDFs, presentations, spreadsheets, and more directly in Gemini · Published 2026-10-29; checked 2 November 2026.
- Google Workspace Updates: Create, preview, and edit files directly in the Gemini app · Published 2026-10-29; checked 2 November 2026.